Airbnb Statistics: Is Airbnb Still Worth It in 2026?

Discover the latest Airbnb stats, from global revenue and market growth to average daily rates, number of listings, monthly earnings, occupancy rates in major U.S. cities, and worldwide user demographics.
Key Takeaways
- Airbnb's revenue climbed from $2.56 billion in 2017 to $12.24 billion in 2025.
- North America continues to hold the largest market share of any region.
- See which U.S. cities lead the market in number of listings, ADR, monthly revenue and occupancy rates.
- Discover the latest Gen Z travel trends on the platform.
- Learn why interest in U.S. national parks has jumped 35%.
If you're curious about Airbnb's performance in 2026 and whether investing in an Airbnb business is still profitable, here's what you should know: Airbnb is performing better than ever.
Sure, Airbnb could be doing well, even better than ever as a company, but how does this reflect on individual hosts wanting to make a stream of passive income or a full-time living?
Here are some Airbnb statistics you may find interesting:
- Every second, 6 guests check into an Airbnb listing.
- There are 9+ million listings on Airbnb, run by five million hosts.
- Airbnb is active in over 220 countries and 150.000 cities
- Airbnb's Gross Booking Value grew 16 percent year-over-year in Q4 2025.
- The average host in the U.S earns $15,800 annually.
- 200M+ registered users who have booked over 1 billion guest arrivals.
- About 70% of Airbnb guests are aged 25 –40.
- Only about 18% of Airbnb users are 50 and older.
- 41% of Airbnb hosts in the United States hold Superhost status.
- On average, Superhosts earn 29% more revenue per year than standard hosts.
- Most Airbnb stays in New York City, USA, have been longer-term rentals since January 2024.
- As many as 77% of Airbnb users said their desire to live like locals made them choose Airbnb.
- The average booking window for Airbnb reservations is 33 days.
Where Airbnb Hosts Can Find Accurate Airbnb Statistics and Data
Where do the major income opportunities lie in vacation rentals? By analyzing Airbnb statistics, you'll notice that some locations have higher revenue potential than others. The truth is that rental earnings depend on location, property size, and market demand. Your next Airbnb could be in a beach destination, a ski resort, or a metropolitan area. Those are all different markets.
When looking at average figures, you need to consider both peak and slow seasons. You also have to decide what type of property works best in a given market.
For example, it's easy to see why New York is dominated by long-term rentals (monthly stays), given the crackdown on short-term rentals in metro areas like New York.
For comprehensive Airbnb statistics and in-depth insights, you can research Airbnb data analytics platforms such as AirDNA, Mashvisor, or Airbtics. What's great about these data providers is how accurately you can estimate income potential and occupancy rates for very specific locations.
One neighborhood could be more lucrative than another, so the only way to find out is to compare them.
General industry reports are available to users of industry report websites such as Statista and other third-party research websites.
Let's take a peek at some of the important Airbnb statistics to understand market trends and key metrics you should pay attention to.
Global and Regional Airbnb Revenue
It's no secret that the US market (North American market) and Europe are two of the largest short-term rental markets for Airbnb.
However, Latin America, India and the Asia Pacific are also keeping pace. Many of these regions are growing their number of listings neck and neck. It makes Airbnb the go-to app not only for booking accommodation but also for getting inspired and deciding where to travel next.
In 2025, Airbnb continued to expand beyond its traditional core markets. Nights booked from expansion markets grew at roughly twice the rate of those in established regions.
Performance was particularly strong in India, Brazil, and Japan. India emerged as one of Airbnb’s fastest-growing origin markets. Nights booked from India increased by 50 percent year over year.
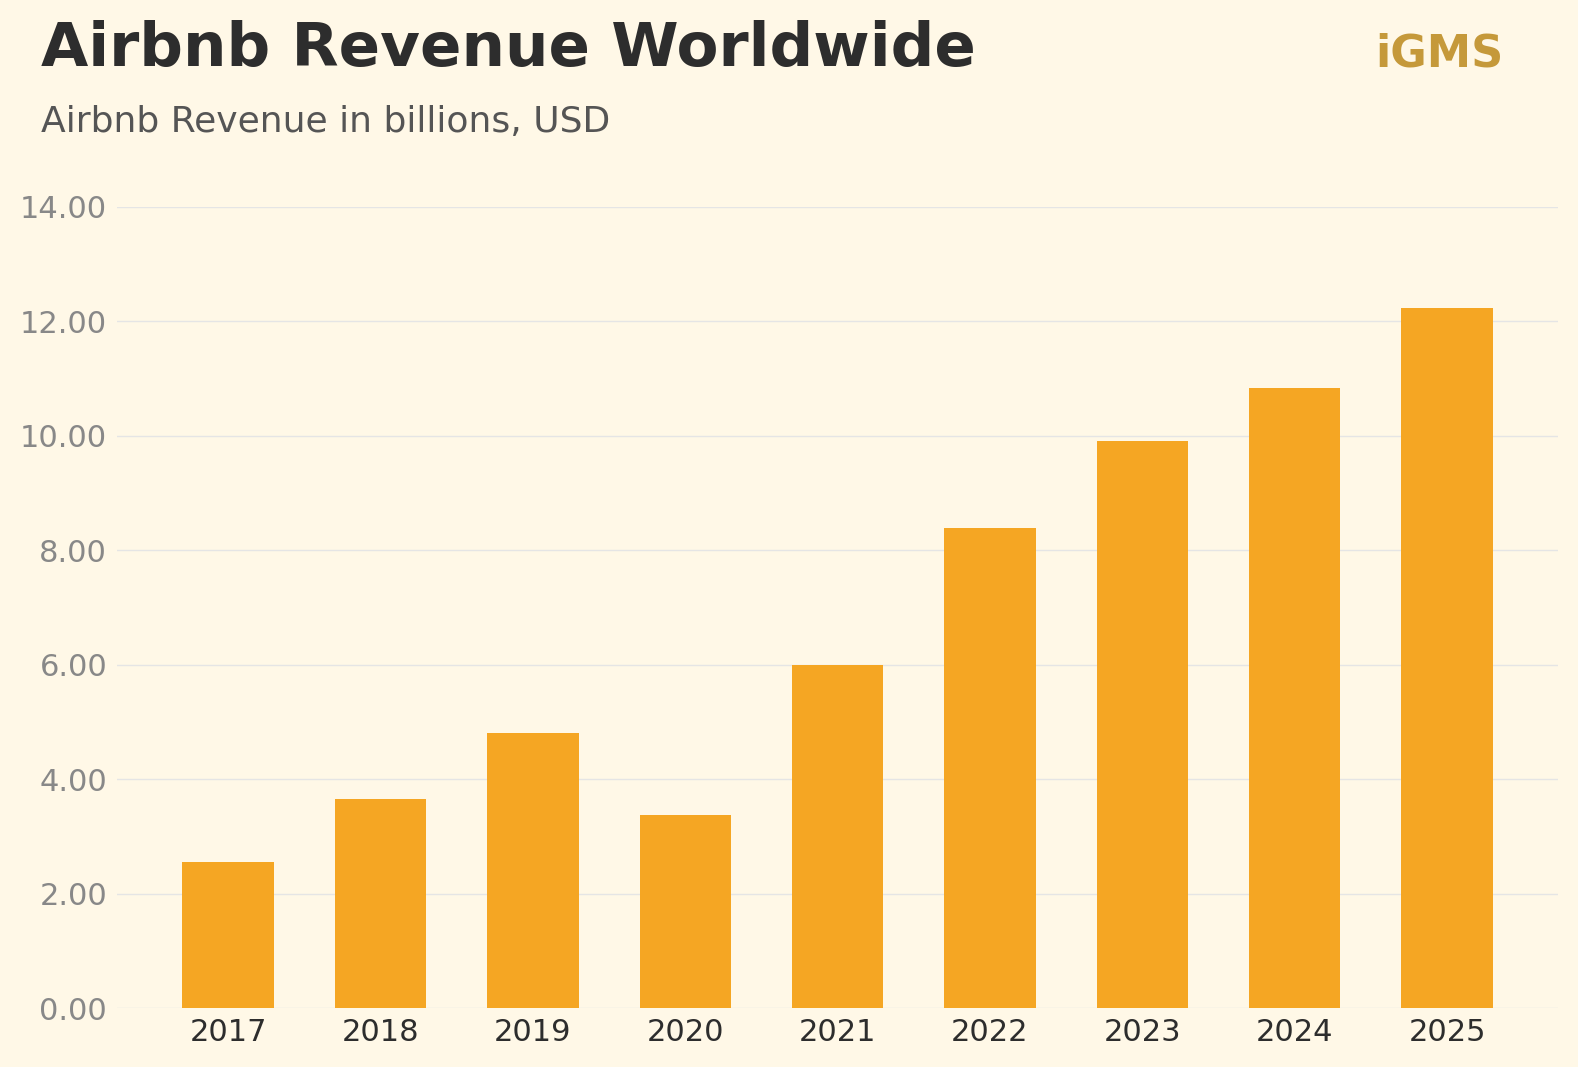
Airbnb Revenue Worldwide
Airbnb's revenue grew from $2.56 billion in 2017 to $12.241 billion in 2025, according to Macrotrends. That’s an impressive 12.02% increase year-over-year. After a temporary halt when the COVID pandemic hit in early 2020, causing revenue to plummet, it has since rebounded exponentially.
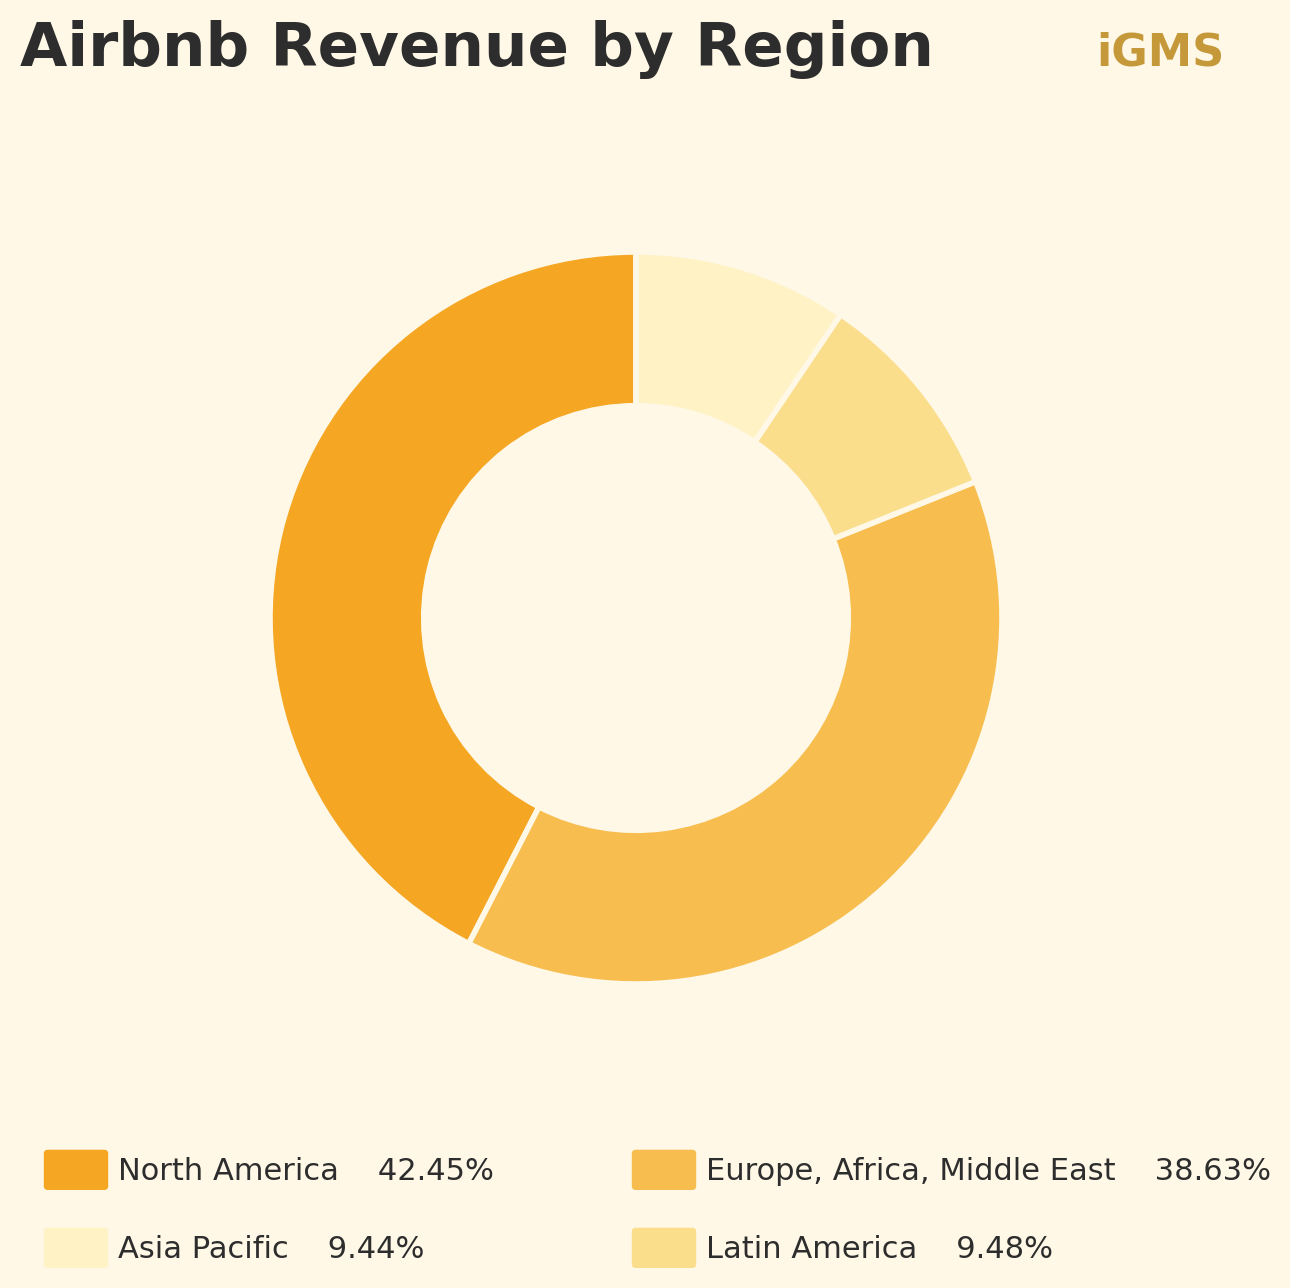
Airbnb Revenue by Region
Over the years, Airbnb has expanded across continents and continues to grow. Its largest markets—the U.S., Canada, the UK, Australia, and France—have seen consistent levels of nights booked.
Airbnb CEO Brian Chesky said the company needs to expand more into the international market with vacation rentals.
Airbnb's focus moving forward will be on less mature markets, including Mexico, Brazil, Germany, Italy, Spain, Switzerland, the Netherlands, India, China, South Korea, and Japan.
In 2025, Airbnb's revenue share by region looked like this:
Asia Pacific 9.44%
Latin America 9.48%
Europe, Africa, Middle East 38.63%
North America 42.45%
Top 20 U.S. Cities Ranked by Number of Airbnb Listings
The number of active Airbnb listings is a good indicator of the market size and its maturity. A lot of competitors is a good sign that the property could be profitable from day one.
These are the 20 U.S cities with the most Airbnb listings:
- Kissimmee, FL: 10,733
- Miami, FL: 7,606
- Austin, TX: 6,484
- Las Vegas, NV: 6,095
- Houston, TX: 5,936
- Nashville, TN: 5,830
- San Diego, CA: 5,829
- Sevierville, TN: 5,089
- Davenport, FL: 4,674
- Los Angeles, CA: 4,400
- Atlanta, GA: 4,311
- Orlando, FL: 4,266
- Myrtle Beach, SC: 4,251
- Panama City Beach, FL: 4,211
- Chicago, IL: 4,205
- Fort Lauderdale, FL: 4,178
- Destin, FL: 4,172
- Seattle, WA: 4,063
- New Orleans, LA: 3,990
- San Antonio, TX: 3,899
Top 20 U.S. Cities Ranked by Average Monthly Revenue
If you're doing market research, one of the first things to analyze is average monthly revenue. However, be aware not to compare apples to oranges. Studio apartments are hard to compare to 4-bedroom properties and private rooms to luxury suites. Compare average bookings and calculate the average income of similar properties.
Simply put, average monthly revenue is the annual income of Airbnb listings divided by 12. It doesn't take into account seasonal fluctuations, although it gives you an idea if your property could be profitable in that particular market. Total nights booked is the gross amount, so keep that in mind if you'd like to calculate net income.
These cities in the U.S. have the highest average monthly revenue over a 12-month period:
- Hanalei, HI: $25,624
- Snowmass Village, CO: $21,920
- Nantucket, MA: $21,467
- Westhampton Beach, NY: $21,145
- Amagansett, NY: $19,776
- Ocean Beach, NY: $19,487
- Aspen, CO: $19,365
- Kapolei, HI: $15,981
- Anna Maria, FL: $15,662
- Sag Harbor, NY: $15,244
- Key West, FL: $15,102
- Stinson Beach, CA: $14,892
- Paradise Valley, AZ: $14,717
- East Quogue, NY: $14,663
- Edgartown, MA: $14,227
- East Sandwich, MA: $13,913
- Paia, HI: $13,680
- Montauk, NY: $13,508
- Kahuku, HI: $13,439
- Saint Helena, CA: $13,421
Top 10 U.S. Cities with the Highest Airbnb Average Daily Rate
By looking at the metric called average daily rate, Airbnb hosts will get insight into the average price guests pay per night.
In the USA, an Airbnb host can expect to earn an average daily rate of $347 (Rabbu). These are cities with the highest ADR:
- Oxford, Mississippi: $460.59
- State College, Pennsylvania: $448.26
- Tuscaloosa, Alabama: $412.95
- Anaheim, California: $386.17
- Ventura/Oxnard, California: $372.35
- South Bend, Indiana: $359.44
- Nashville, Tennessee: $352.78
- Portland, Maine: $346.54
- Savannah, Georgia: $342.22
- Green Bay, Wisconsin: $330.59
Top 20 U.S. Cities with the Highest Airbnb Average Occupancy Rate
Airbnb occupancy rate is a key metric that tracks the percentage of nights a property is booked versus how many nights it's available. It’s a great way to see how well a listing is performing and the overall booking consistency.
A higher occupancy rate generally indicates strong demand and effective property management, while a lower rate suggests low demand.
Mashvisor's list of cities with the highest occupancy in 2025 looks like this:
- Honolulu, HI: 65%
- Coconut Grove, FL: 64%
- Washington, DC: 63%
- Miami, FL: 62%
- Lauderdale By The Sea, FL: 62%
- Los Angeles, CA: 62%
- Miami Beach, FL: 60%
- Charlotte, NC: 59%
- Fort Lauderdale, FL: 58%
- Davenport, FL: 58%
- San Diego, CA: 57%
- San Antonio, TX: 56%
- Seattle, WA: 55%
- Tucson, AZ: 55%
- Austin, TX: 54%
- Chicago, IL: 52%
- Nashville, TN: 50%
- Houston, TX: 50%
- Tampa, FL: 50%
- Atlanta, GA: 49%
Airbnb Statistics on User Demographics
Airbnb has seen a surge in both users and hosts over the years. In addition to a growing guest base, it has the fastest-growing host demographic among booking platforms. The host community has surpassed 5 million globally on the Airbnb platform.
Many have seized the opportunity to invest in short-term rentals. This trend highlights how people have recognized the potential of short-term rentals as a viable income stream.
Airbnb’s user base has always been predominantly young, preferring local, authentic experiences over the cookie-cutter nature of hotel rooms.
Airbnb guests love the personalized, tailored approach. In every region, Airbnb guests seek distinctive accommodations that reflect the local culture and charm.
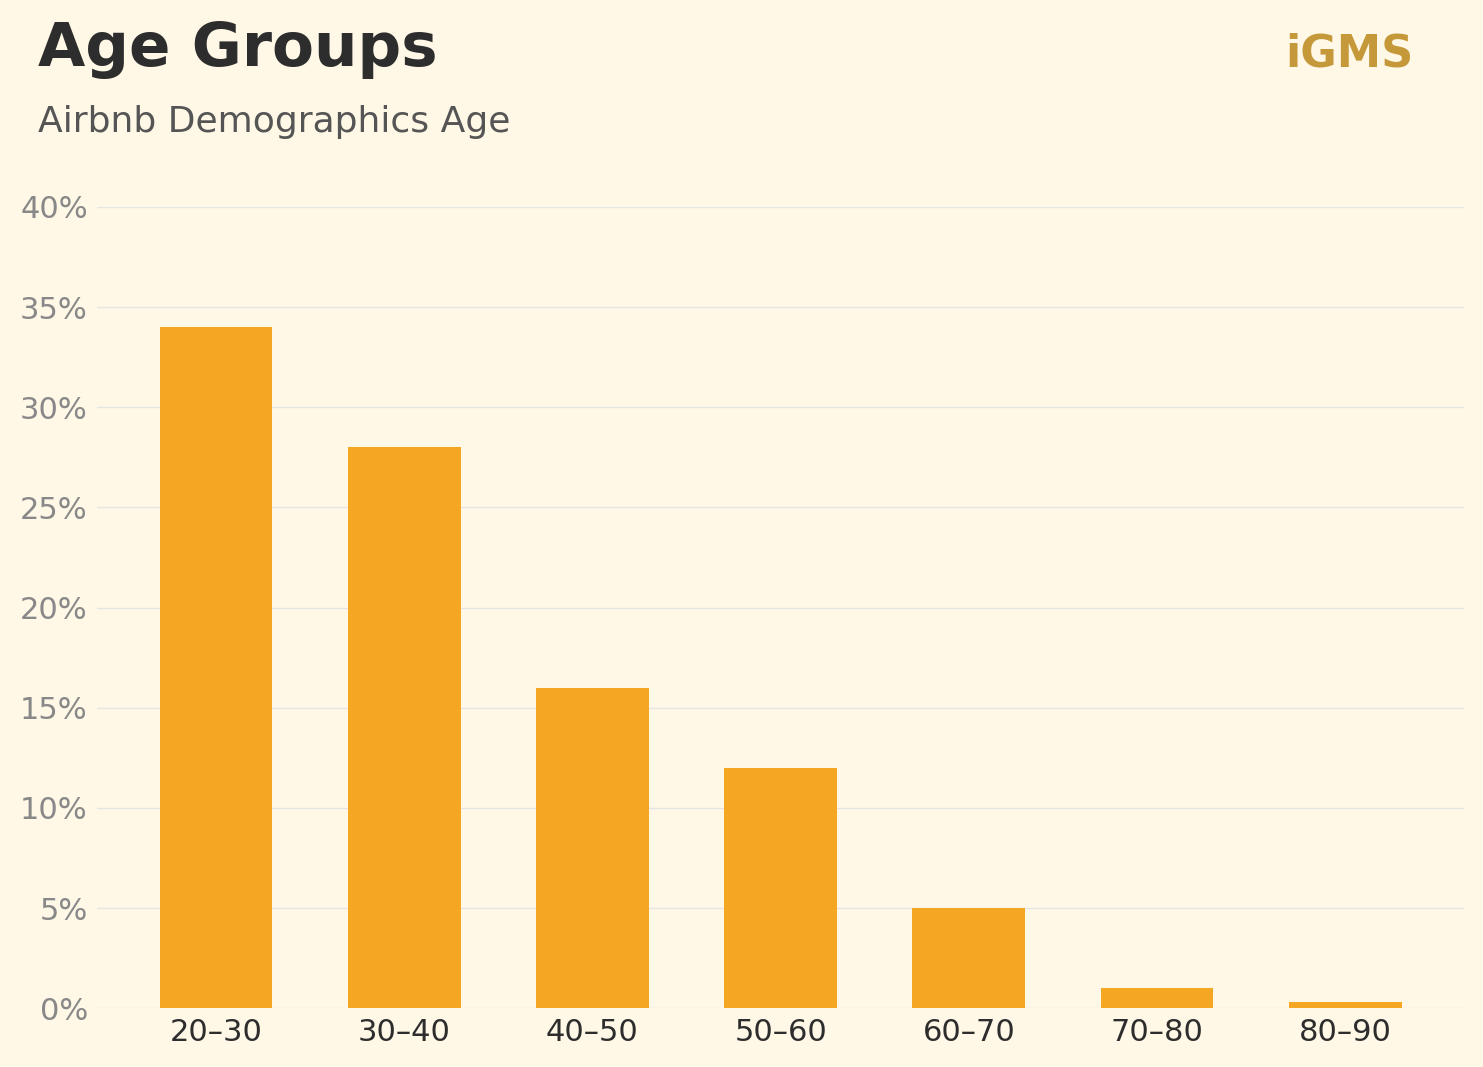
Age Groups
Two-thirds of Airbnb's user base consists of Millennials and Gen Z, while only about 6% are over 60 years old. Historically, Airbnb’s primary demographic skewed toward younger travelers, who were also early adopters.
However, this has evolved over time, and today Airbnb hosts can expect guests of all ages, though baby boomers remain less common.
In terms of gender, around 54% of the user base identifies as female, while 46% identify as male.
It’s interesting how much age plays into travel habits. While other groups might want a long, slow vacation, Gen Z is all about the 'quick trip' lately, according to an Airbnb report. They’re increasingly booking 1 or 2-day international stays because they’d rather have a fast-paced, culture-filled weekend.
Purpose of Stay
The ratio of tourists to business travelers on the Airbnb platform is quite balanced. The percentage of business travelers choosing Airbnb over hotels initially grew because Airbnb was more affordable. Today, some business travelers prefer the home-like comfort of an Airbnb, regardless of the cost.
The purpose for many travelers is stepping away from screens and “touching grass”. That's why interest in U.S. national parks is surging 35 percent, and bookings for nature and outdoor experiences are outpacing all other categories.
U.S. Top National Park Destinations are:
- Acadia National Park
- Jackson Hole, WY (near Grand Teton National Park)
- Shenandoah National Park
- The Great Smoky Mountains National Park
- Yosemite National Park
Number of guests
47% of Airbnb bookings are made by groups of 3 or more guests, according to Worldmetrics. This means if you manage 2+ bedroom vacation rentals that accommodate groups, you have a good chance of being booked.
Hosts can use this insight to tailor their properties by offering additional beds or larger spaces to attract group bookings.
Nearly 25% of guests worldwide travel solo and tend to prefer compact accommodations such as studios (Source: iProperty Management).

What Does This All Mean for Airbnb Hosts
While identifying booking trends across different regions is important, analyzing Airbnb statistics in local markets is crucial. Why?
Global figures don't mean much if your own neck of the woods tells a different story. Before jumping onto Airbnb, use tools like AirDNA, AllTheRooms, Rabbu or Airbtics to run the numbers. That research will tell you exactly whether you’re looking at a profitable investment.
The Biggest Challenges for Airbnb Hosts According to Data
The vacation rental world has changed. In 2026, it’s not enough to just "have a spare room". You have to run your business like a pro to stay ahead of these three major challenges:
- Stricter rules
The biggest hurdle right now is regulation. Local governments are cracking down with much tougher laws. Whether it’s a limit on how many days you can rent or mandatory expensive licenses, staying legal is essential. - A crowded market
Because it’s so easy to list a property, tourist hotspots are now flooded with Airbnbs. Most of them look exactly the same. Think of the "cookie-cutter" apartments. To get booked, your place needs to stand out. - The AI revolution
Technology is moving fast. Better not stay behind. Professional hosts are now using AI to handle the manual tasks like setting dynamic prices and analyzing the market. iGMS, as your property management tool, uses AI-powered automated messages for guest management.
What's Next for Vacation Rentals?
Airbnb continues to solidify its competitive edge, setting a high standard for other platforms within the industry. The company has shown interest in expanding and strengthening its position further into regions like Asia, Latin America, and underperforming areas of Europe.
The U.S. remains the largest market overall, and hosts planning to invest in vacation rental properties should focus on understanding local demand and staying informed about Airbnb restrictions in residential areas to avoid potential issues.
Other online travel agencies like Expedia and Vrbo shouldn't be overlooked either. By the end of 2025, the Expedia Group reached a massive $120 billion in total gross bookings and $14.7 billion in revenue, proving it’s a critical platform for reaching a global audience. Listing on Expedia puts you in touch with a massive pool of travelers who prefer to book through established travel sites.
In comparison, Vrbo (part of Expedia Group) generated an estimated $3.81 billion in 2024. This represents substantial growth for Vrbo compared to its $1.22 billion revenue in 2016. They have tripled their income.
Each booking platform shows growth in both revenue and user base, indicating that short-term rental properties still have a bright future.
At its core, the vacation rental market is evolving to meet a deep-seated desire for genuine interaction. The booking process may be digital, but the end goal is stubbornly analog, centered on bringing people together in the real world.
Takeaway
Airbnb data gives every reason for optimism. Demand is growing, new markets are opening up, and travelers are spending more than ever on unique, local experiences.
For hosts willing to do the homework, find a profitable market, and avoid markets with regulatory challenges, the opportunity to build meaningful income through short-term rentals remains very much within reach.
If you're already a host, you can step up your game by optimizing and automating your daily tasks.
Keep your calendar updated across platforms, assign tasks to your team automatically, and automate guest communication. Check out how iGMS can help you.