Short-Term Rental Market Analysis: Top Hotspots and Trends for 2025

Short-term rentals have evolved from being an alternative form of accommodation to becoming a mainstream asset class. In this article, we uncover how to approach the vacation rental business, analyze an increasingly competitive market, and identify the key factors that drive remarkable growth.
Discover actionable insights into the vacation rental hospitality industry, including:
- Key trends shaping the vacation rental industry in 2025
- Top short-term rental investment opportunities and hotspots in the U.S., Europe, and Worldwide
- Straightforward tips for analyzing the STR market with high predictability of rental income
- Essential market analytics tools and how to use them to stay ahead and make smart investment decisions

Short-Term Rental Industry at a Glance
If we look at the big picture, we'll note how the numbers tell a story of sustained expansion and maturation. The global vacation rental market reached USD 97.85 billion in 2025, with projections indicating growth to USD 134.26 billion by 2034, according to Precedence Research.
In the United States alone, the market demonstrates remarkable consistency, with an expected annual growth rate of 4.12% that should drive the market volume to US$24.78 billion by 2029.
Geographically, the market shows concentration in developed regions, with Europe, North America, and Asia Pacific claiming the largest market shares. However, some other areas of the world, like Latin America, are growing as well.
Online booking dominates the market with 59.4% of the market share, according to Future Market Insights Inc. The leading apps remain Airbnb, Expedia (Vrbo), and Booking.com.
Perhaps most significantly, demographic trends point to continued growth driven by younger generations. Millennials are expected to fuel market expansion. By the end of 2025, Gen Z and millennials are expected to account for around 75% of Airbnb's traveler base. (Precedence Research).
Airbnb has taken steps to appeal to new generations with Experiences and Airbnb Icons, and short-term rental owners could also consider how they can enrich their experience and appeal to younger generations. Demographic groups who are now driving the market are solo travelers, couples, and remote professionals.
Key Short-term Rental Market Trends in 2025
What are the dominant forces shaping trends in the vacation rental industry? Which types of short-term rental properties are most in demand? What practices are we likely to see in key markets?
Let's break it down.
Growth of eco-friendly and sustainable stays
Environmental friendliness remains one of the steady factors that affect vacation rentals. Concerns about climate change, resource conservation, and reducing carbon footprint necessitate a more sustainable approach to vacation rental listings, particularly among high-end luxury travelers.
Around 90% of consumers look for sustainable options, and 50% of guests are willing to pay more to get them. This can mean having an eco-conscious design, solar panels, energy-efficient appliances, and sustainable materials.
Regulatory changes
In recent years, short-term rentals have faced crackdowns and stricter regulations in urban areas. In cities like Los Angeles and New York, obtaining permits and licenses has become more difficult. In some zones, they're outright prohibited, while others now require annual renewals or the host's on-site presence.
Hosts have become more proactive in navigating these restrictions. There are signs the situation is stabilizing as clearer and more predictable rules begin to emerge.
Real estate investors who didn’t want to deal with such unpredictability in the first place have shifted their focus to rural or suburban areas, as well as established vacation destinations.
Rise of the multiplatform approach
What started as listing a vacation rental on Airbnb has evolved into strategic cross-listing across multiple platforms to increase revenue. Driving bookings from diverse sources reduces dependence on the 'gods of the algorithm.'
More touchpoints typically lead to faster booking cycles and fewer vacancy periods. Moreover, performance data from one platform can help optimize results on others, and inform decisions for future properties. The more data you gather, the deeper your understanding of market demand.
Hosts are turning to direct booking websites as part of a multichannel approach, allowing them to bypass third-party fees entirely. That’s where iGMS comes in—it syncs all platforms and calendars, including your own website, so all operations are centralized. A good property management system for vacation rentals must include a channel manager, which makes cross-listing a practical and effective strategy.
Dominance of unique rentals
Vacation rentals are entering a phase we can call the "golden age of unique rentals". Think of cabins, treehouses, a house in the form of a potato, a spaceship, or a Barbie house.
The number of unique accommodation listings grew by 123% in the past few years from 2020 to 2024, as AirDNA reports. This is a sign that guests are hungry for unique experiences. Investing in interior design, amenities, and branding your listing are all strategies that can make you a leader in the short-term rental market.
Sports, wellness, and services in tourism
Guest preferences reveal a strong desire for active vacations and pre-planned activities. Platforms like Airbnb were among the first to identify the growing desire for tourists to connect deeply with the places they visit, seeking unique experiences and activities that extend beyond accommodation.
Increasingly, tourism activities are revolving around sports, wellness, and adventure. Travelers are now selecting vacation spots that enable pursuits like hiking, trekking, and biking.
In its 2025 summer release, Airbnb rolled out a new feature called "Services." Now, guests can easily book a massage, schedule a photo session, get their makeup done, arrange a romantic dinner for two prepared by their favorite chef, or book a spa treatment. This feature not only moves Airbnb closer to the full-service hospitality model, but it also creates opportunities for local hosts to collaborate with service providers or even earn referral fees or offer services themselves.
Remote work
Approximately 22% of the U.S. workforce works remotely in 2025— a decline from pandemic peak levels, but still much higher than pre-pandemic levels. The hybrid model has become the most common arrangement.
Remote work is one of the key factors behind the rise of stays of 30 days or longer, typically referred to as mid-term stays. It’s safe to say that remote and hybrid work models will continue to shape how people travel and seek comfort in short-term rentals.
Rise of AI technology
AI indirectly influences the dynamics of the rental market. It can be used on online booking platforms to enhance the consumer experience. AI can analyze data to offer more personalized options for customers to choose from and analyze patterns of consumer behavior.
AI technology and machine learning also help property owners optimize their pricing through dynamic pricing, improve marketing, and increase guest satisfaction. However, many AI applications are still in their infancy, so we await to see how they will reflect the guest experience online and in smart home appliances in the near future.

Best Places to Invest in 2025
We selected a few top vacation rental hotspots using the following criteria:
- growing and steady demand
- flexibility of regulations
- annual revenue potential
- geographical region
- market score
U.S. Top Picks
The U.S. and North America have consistently been among the top markets for short-term rentals, and that remains true today. As some metro areas have introduced stricter regulations, investors are shifting their focus to more STR-friendly destinations, such as traditional tourist hotspots like coastal beach towns, mountain retreats, national parks, and lakefront areas.
At the same time, suburban and rural regions are booming with small-town gems that attract travelers looking to get off the beaten path, as well as adventurers eager to hike, explore, and reconnect with nature.
According to Airbnb data and other online platforms, several areas in the Midwest are performing exceptionally well. These regions not only offer strong demand but are also located in vacation rental–friendly states and cities, making them especially appealing to investors.
We’ve selected a few destinations that are performing very well based on the AirDNA data.
Indianapolis, Indiana
- Number of listings: 6,520
- ADR: $198.6
- RevPAR (Revenue per Available Rental): $91.2
- Average Occupancy Rate: 46%
- Average Annual Revenue: $15K
As Indiana's capital and most populous city, Indianapolis attracts visitors year-round for:
- Major sporting events like Indy 500 (an annual automobile race), NCAA tournaments, Gen Con (the largest tabletop game convention in the US)
- Conventions and conferences
- Business travel
- Healthcare visits
- Family tourism and weekend getaways
Indianapolis offers relatively low home prices compared to other metro areas, making it easier to get started with a lower upfront investment. That means better cash-on-cash returns. Plus, it has relatively favorable short-term rental regulations.
Kansas City, Missouri
- Number of listings: 2,389
- ADR: $198
- RevPAR (Revenue per Available Rental): $101
- Average Occupancy Rate: 55%
- Average Annual Revenue: $20.1K
Kansas City is emerging as one of the Midwest’s most promising STR markets, offering a solid balance of affordability, demand, favorable STR rules, and rental income potential.
Kansas City is attracting more visitors each year thanks to its:
- Thriving food and music scene (home of jazz and BBQ)
- Popular sports culture
- Robust conference and business travel scene
- Major events and festivals that drive weekend bookings
This diverse mix of travel demand helps maintain a healthy 55% occupancy rate across the year.
South Padre Island, Texas
- Number of listings: 4,184
- ADR: $351.8
- RevPAR (Revenue per Available Rental): $170
- Average Occupancy Rate: 49%
- Average Annual Revenue: $34.6K
South Padre Island is a resort town on a barrier island of the same name, off the southern coast of Texas. South Padre Island is one of Texas’s top coastal destinations. ADR of $325,8 and RevPAR of $170 are numbers that point to high nightly earning power, especially during peak seasons like spring break, summer, and holidays.
As one of the few tropical-style beach towns in Texas, South Padre Island draws consistent interest from both in-state and out-of-state travelers looking for a laid-back, coastal escape without leaving the U.S.
Wichita, Kansas
- Number of listings: 1,051
- ADR: $138.4
- RevPAR (Revenue per Available Rental): $68.3
- Average Occupancy Rate: 53%
- Average Annual Revenue: $11.9K
Wichita may not be the flashiest STR market, but it offers reliable, low-risk returns. For investors looking to diversify into smaller, stable Midwest markets, it checks several key boxes. Wichita’s housing market is extremely affordable, especially compared to national averages.
With a 53% occupancy rate, Wichita shows steady demand driven by:
- Business travel (aerospace, manufacturing, healthcare)
- University visitors (Wichita State, Newman University)
- Regional tourism and events
- Families visiting friends and relatives
While the revenue numbers are more modest than coastal or high-tourism markets, they’re strong relative to property prices and operational costs.
Akron, Ohio
- Number of listings: 553
- ADR: $142.7
- RevPAR (Revenue per Available Rental): $75.3
- Average Occupancy Rate: 53%
- Average Annual Revenue: $13.8K
Smaller cities like Akron may fly under the radar, but they offer a strong mix of affordability, steady demand, and dependable returns. For investors focused on maximizing cash flow in less saturated markets, Akron is an appealing option.
With a relatively low number of STRs of 553, Akron is far less saturated than larger cities. That means less competition and greater visibility for your property on online platforms.
Numbers reflect steady, year-round income potential, especially when paired with Akron’s low property prices and operating costs.
Akron benefits from:
- Proximity to Cleveland (a major metro and business hub)
- Visitors to The University of Akron
- Events at sports venues, cultural centers
- Business travelers tied to the area’s historic ties to the tire and rubber industries
Europe Top Picks
Europe appears to dominate the short-term rental market share, according to Precedence Research.
While major capitals like Paris, London, Rome, and Lisbon continue to drive year-round tourism, we’re shifting focus to other high-performing cities across the continent. Cities like Madrid, Seville, Budapest, Krakow, Naples, Stockholm, and Munich are all thriving in the short-term rental space.
Also, take a look at these hotspots:
The Azores, Portugal
- Number of listings: 6,005
- ADR: $154.9
- Average Occupancy Rate: 64%
- Average Annual Revenue: $18.4K
The Azores islands offer a unique combination of stunning natural beauty, year-round tourism appeal, and a thriving STR market. It’s one of Portugal’s most underrated, but now increasingly in-demand, vacation rental hotspots.
A 64% average occupancy is strong and signals steady demand throughout the year, not just during summer.
The Azores have been gaining international attention as an eco-friendly, adventure-focused destination known for:
- Whale watching, hot springs, and crater lakes
- Hiking, diving, and volcanic landscapes
- Sustainable tourism initiatives
These islands are seeing increased visitor numbers from Europe and North America alike. On the other side, short-term rental regulations in the Azores are more defined, particularly in response to local housing concerns, so vacation rentals probably need proper licensing.
Riga, Latvia
- Number of listings: 3,661
- ADR: $75.1
- Average Occupancy Rate: 58%
- Average Annual Revenue: $7.6K
Riga, the capital of Latvia, blends rich history, beautiful Art Nouveau-style architecture, and a growing tourism sector. It's significantly cheaper than major European markets, and this Baltic region city is delivering solid performance. Riga is one of the most affordable capital cities in the EU for real estate investment.
While Riga sees seasonal peaks in the summer and during Christmas markets, it still attracts:
- Cultural tourists interested in its UNESCO-listed Old Town
- Business travelers
- Digital nomads
- Visitors exploring the Baltic region
Though the average daily rate is modest, the high occupancy helps make up for it. Combined with very affordable property prices and lower cost of living, these numbers can yield attractive cash-on-cash returns. Also, Latvia is generally considered a digital nomad-friendly country. In 2022, they introduced a digital nomad visa.
Vienna, Austria
- Number of listings: 20,992
- ADR: $131.7
- Average Occupancy Rate: 61%
- Average Annual Revenue: $14.5K
Vienna is a city rich in history, with over 100 museums, and the former home of cultural icons like Mozart, and Sisi. Still, it's an incredibly modern and vibrant city.
An increasing number of listings and a 61% occupancy rate in Vienna reflect year-round demand. Even with a mid-range nightly rate, this translates into strong and consistent annual revenue.
Vienna has clear rules and licensing requirements for short-term rentals, but tourism-zoned properties face fewer restrictions. Overall, it is a premium STR market offering high occupancy, steady income, and strong long-term real estate value.
Global markets Top Picks
Buenos Aires and Riyadh are currently the fastest-growing short-term rental destinations, showing remarkable surges in supply throughout 2024 (Lighthouse). Close behind are cities like Dubai, Marrakesh, Rio de Janeiro, Cape Town, and Bogotá—all experiencing significant growth in the STR space.
Outside of Europe and North America, Latin America has seen the most substantial expansion in the Airbnb market, driven by increasing tourism, digital nomad interest, and improving infrastructure.
The Asia-Pacific region follows closely, with countries like Indonesia emerging as STR hotspots, especially in popular destinations such as Bali and Jakarta.
In Africa, South Africa stands out as the continent’s most mature and established Airbnb market, with Johannesburg and Cape Town leading in both listings and guest demand.
Here are some top examples:
Puerto Vallarta, Mexico
- Number of listings: 12,477
- ADR: $206.8
- Average Occupancy Rate: 49%
- Average Annual Revenue: $19.5K
Puerto Vallarta is one of Mexico’s most popular beach destinations, and also one of the country’s most profitable short-term rental markets.
Puerto Vallarta draws millions of travelers annually, thanks to:
- Beautiful beaches and scenic coastline
- Vibrant nightlife, dining, and art scenes
- LGBTQ+ friendly culture and events
- Whale watching, boat tours, and outdoor adventure tourism
Besides being a tourist destination, it’s become a hot spot for digital nomads, retirees, and long-stay travelers. That opens up potential for mid-term rentals as well, especially in the low season.
Cape Town, South Africa
- Number of listings: 29,076
- ADR: $160.3
- Average Occupancy Rate: 56%
- Average Annual Revenue: $11.6K
Cape Town in South Africa is offering a strong seasonal demand, high-quality properties at relatively low prices, and a thriving STR ecosystem totaling more than 29,000 listings.
Cape Town consistently ranks as one of the most beautiful cities in the world, drawing visitors for:
- Iconic landmarks like Table Mountain and Robben Island
- Stunning beaches and the Cape Winelands
- Outdoor adventure, wildlife, and cultural attractions
With an ADR of $160.3, even moderate occupancy can produce strong seasonal earnings, especially during Cape Town’s high-demand summer months (November to March) and especially if your property stands out and performs above average.

How to Perform a Short-Term Rental Market Analysis and Find Lucrative Opportunities
If you plan to buy a property (or multiple properties) and turn them into vacation rentals, your first step should be conducting extensive research on your target market.
To spot market trends and identify properties worth investing in, you'll need to perform a data-driven analysis. While various tools can offer valuable insights, it’s essential to understand how to interpret the metrics and key performance indicators that matter most.
Data-driven analysis + local insights
The ideal approach is to combine data analysis with an in-person visit to the location and your own research. This helps you evaluate the surroundings, proximity to attractions, overall profitability, and potential maintenance costs. These are all key considerations when buying a new property.
And if you already have a property in mind or you’re thinking about turning a second home into a vacation rental, you can still perform a rental analysis to assess the competitive landscape, understand its maximum earning potential, and figure out what you need to do to make your listing stand out.
Look at key performance indicators
Some local markets have greater potential for exponential growth, while others are tougher to enter due to strong competition, but still offer potential. Then there are those where demand is quite low.
It's highly unlikely to create tourist demand where none exists. However, you can leverage existing demand by directing visitors toward your vacation rental.
Here are key metrics that can provide valuable insights into the short-term rental market:
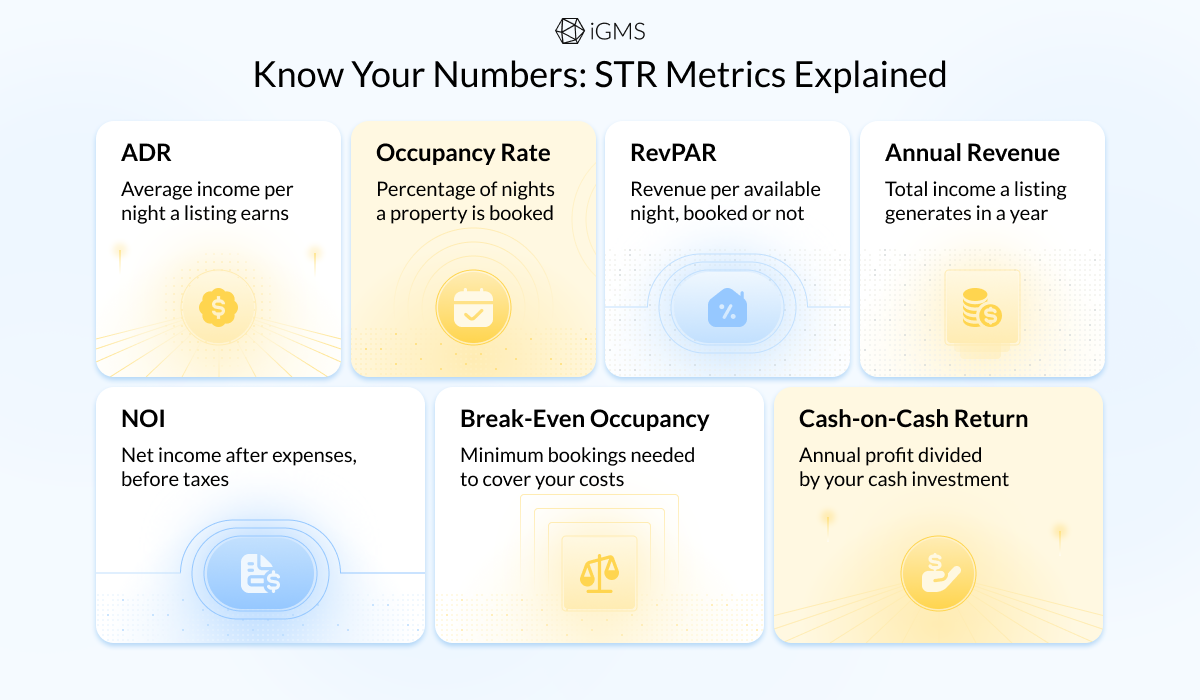
- ADR
Average daily rate. This metric tells you the average cost per night for listings. The best practice is to filter for similar properties and compare their ADRs. You wouldn't want to compare a luxury mansion with a swimming pool to a studio apartment.
- Occupancy rates
The occupancy rate measures booked nights in relation to vacant nights. A consistently high occupancy rate suggests strong demand. Generally speaking, occupancy shouldn't fall below 50%, especially not during peak season.
- Average annual revenue
Short-term rental annual revenue indicates profitability. Since short-term rental properties are susceptible to seasonal fluctuations, annual revenue is the most accurate figure to consider when gauging profitability potential.
- RevPAR (Revenue per Available Rental)
This is an important metric in the short-term rental industry. It shows how much revenue a property earns per available night, whether it's occupied or not.
- Costs vs Revenue
Do research on-site to predict utility, maintenance, STR taxes and other expenses, and then compare these to your expected revenue. It's wise to keep a buffer, as vacation rental expenses are typically a bit higher than those of a normal household.
A crucial question to ask yourself about vacation rentals is whether you will hire property managers or become a DIY host. Property management companies charge a fee, so ensure you're comfortable with the costs that will be added to your expense list.
If you're buying a new property
When buying a new property, you also need to have in mind metrics that measure not only the profitability of the property itself, but the return on your investment.
Taking out a loan, renovating, and furnishing a property make it a significant investment. When it comes to short-term rentals, pay attention to:
- Cash on cash return
Cash-on-cash return measures the annual return on the actual cash you invested in a form (and not the total property value). It's especially useful for mortgage-financed investments when you make a down payment. A good CoC return is considered to be 10% and above.
- Net operating income
NOI is your property’s income after all operating expenses, but before mortgage payments and taxes. It reflects how profitable your rental is at its core.
- Break-even occupancy rate
This indicates the minimum occupancy rate required to cover all your fixed and variable costs, ensuring you’re not incurring a loss.
Analyse factors that shape the short-term rental market
Various factors influence the short-term rental market. You may want to understand better:
- Local market dynamics
Even within the same city, STR performance can vary significantly depending on the neighborhood. The market size of one area can be substantial, with that area staying fully booked thanks to nearby attractions, events, or business hubs, while another neighborhood struggles just a few miles away. Factors like local festivals, transit access, and walkability all affect guest decisions. That's why it's crucial to understand the area before you invest.
- Seasonality
Seasonality has a big impact on occupancy and cash flow. Ski towns thrive in winter, while beach destinations see a spike in summer. But year-round or dual-season markets, like mountain towns with both winter sports and summer hiking, offer more stable income throughout the year.
- Local regulations
Some major cities impose stricter regulations. Strict rules in urban areas often limit how many hosts can operate legally, driving up demand for compliant listings and often driving up the nightly rate. However, you may need to obtain a license, meet zoning requirements, or even live in it as your primary residence, which can limit your hosting options.
- Tourist demand and demographics
Vacation rental owners must think about attracting guests and what target guest segments they want to attract to their vacation rental property. They could be backpackers and students seeking affordable accommodation, high-net-worth individuals seeking exclusive estates, international tourists exploring American cities, domestic tourist on a weekend getaway, or remote workers.
- Property types in demand
Every property type aligns with some travel preferences or trends. Urban condos attract business travelers and couples seeking convenience, while tiny homes have become social network favorites among younger guests prioritizing unique experiences.

Top Tools for STR Market Research and How to Use Them
If you want to take short-term rental revenue management seriously, you need to get good at using digital tools.
These are some of the top market research apps in the game:
AirDNA
AirDNA is a top tool that provides market performance data, revenue forecasts, and occupancy trends. Use its MarketMinder tool to analyze demand, compare key metrics like ADR and RevPAR across neighborhoods, and identify high-ROI, undervalued markets.
Airbtics
Airbtics is another tool with global market coverage that offers real-time pricing insights and ROI estimates. Use it to analyze returns by bedroom count and location, get dynamic pricing recommendations, and find the best-performing property types in your target market.
Mashvisor
Mashvisor provides heatmaps and investment calculators to guide your STR decisions exclusively for the U.S. market. Use it to spot high-demand areas, analyze cash flow and cash-on-cash return, and even revenue potential. It also features MLS property listings and seller connections, helping you find and analyze investment-ready homes in one place.
Final thoughts
Short-term rental market analysis isn't as complicated as you might think. With the tools we just mentioned, you're truly empowered by data and can easily make sense of trends in any given market. However, data analysis shouldn't replace your intuition and on-the-spot research; they should complement each other to understand not only what market thrives with demand, but also how your brand can stand out.
If you need help managing your short-term rental properties, automate the process with iGMS—so you never have to worry about syncing calendars, assigning tasks to cleaners, or dealing with task after task that never seems to end.