Airbnb Demand in 2026: How to Find Profitable Markets
This guide shows you how to measure Airbnb demand in any market, using real market data instead of gut feel. It also covers what's driving short-term rental demand in 2026, where demand is strongest, and how to capture more of it once you're listed.
Key Takeaways
- Airbnb demand is still growing. Airbnb's nights and seats booked rose 10% year over year in Q2 2026, and AirDNA forecasts U.S. short-term rental demand growth of 2.7% for 2026, matched by 2.7% supply growth.
- The most reliable way to measure Airbnb demand is to analyze at least 12 months of occupancy rates, average daily rate (ADR), and active listings for comparable properties, at the neighborhood level.
- Occupancy benchmarks vary by data source. AirDNA expects U.S. occupancy to average 57.4% in 2026, while many guides still quote a 48% national average. Anything above 65% is generally considered strong.
- Big events move the needle. In iGMS's own World Cup study, listings within 2 km of a stadium earned roughly 30% to 42% more than comparable control markets.
- Stricter local regulations, suburban spillover, and seasonal demand patterns can matter more to your revenue potential than any national average.
If you're investing in short-term rentals, the question that matters most is simple: is there real, durable demand in the market you're eyeing? The short-term rental market has shifted a lot over the past few years, and 2026 looks different again. Some markets are stabilizing, others are tightening under new rules, and entire property categories are pulling ahead.
This guide is for hosts, property managers, and real estate investors who want to make data-backed decisions. We'll break down how to determine Airbnb demand step by step, which free Airbnb data and paid tools are worth using, and what you can do to capture more bookings once you're live.
What Is Airbnb Demand?
Airbnb demand is the number of nights travelers book, or want to book, in a specific area over a given period. The clearest way to measure it is the occupancy rate, which compares nights booked with nights available. When occupancy rates hold steady or climb over 12 months as new listings arrive, the market has real demand.
For real estate investors and hosts, it's the clearest signal of whether an Airbnb market is worth your time and capital.
Occupancy alone doesn't tell the whole story, though. You'll want to read it alongside average daily rate (ADR), revenue per available night, booking lead times, and supply growth. Together, these key metrics show you whether demand is strong, growing, and profitable, or just busy.
How to Determine Airbnb Demand in Any Market
Here's the process we recommend for evaluating Airbnb demand before you buy, list, or expand. It works for a whole city, a single neighborhood, or one specific property.
1. Pull at least 12 months of market data
Every good market analysis starts with historical Airbnb demand data, not a single good month. Airbnb analytics platforms like AirDNA, Mashvisor, Airbtics, Rabbu, and PriceLabs collect Airbnb market data on key Airbnb metrics like active listings, occupancy, ADR, and revenue across thousands of markets, so you can compare markets on a like-for-like basis. Most offer some free Airbnb data, such as city-level market averages, with deeper neighborhood and property-level data behind a paywall.
Look at the trend, not the snapshot, and track market performance across all four seasons. If occupancy trends hold or rise across a full year, the market demand is real. If they swing wildly or slide, dig deeper before you commit.
Not sure which platform to pick? Our breakdown of Airbnb analytics tools and our Mashvisor vs AirDNA comparison cover the main options.
2. Analyze demand against supply trends
Demand only tells you half the story. You also need to know how many new listings are competing for the same guests.
A market becomes saturated when supply outpaces demand. You'll see it in the data as falling occupancy rates while the number of active Airbnb listings keeps climbing. The good news for 2026 is that supply growth has cooled sharply. AirDNA expects available listings to grow 2.7% this year, a far cry from the roughly 20% expansion the market saw in 2021 and 2022.
To analyze demand properly, compare the growth in booked nights with the growth in active listings for the same market. If demand grows as fast as or faster than supply, existing hosts are in good shape.
3. Map seasonal demand patterns
Most markets have a peak season, a shoulder season, and a slow season, and Airbnb demand can double or even triple between them. AirDNA's data shows Park City, Utah, for example, sees short-term rental demand double or triple from January to March, when ski season is in full swing.
Plot occupancy and nightly rates month by month for at least a year. These demand patterns tell you:
- When you'll earn most of your rental income
- How long your slow season lasts, and how deep it gets
- Whether shoulder months are an opportunity to price aggressively and capture demand competitors miss
Locations with year-round draw, like coastal Florida or southern California, smooth out seasonality risk. Pure summer or winter destinations need a sharper pricing strategy to stay profitable in the slow months.
4. Identify demand drivers and local events
Next, identify demand drivers: the reasons people visit. Tourist attractions, national parks, universities, hospitals, business districts, and convention centers all create steady demand. Local events create spikes.
Indio, California, is a classic example. Short-term rental demand there spikes sharply in April around the Coachella and Stagecoach festivals. AirDNA's data also shows guests tend to book event stays farther in advance than usual, so the bookings arrive early.
Major events can lift revenue dramatically for hosts who build event dates into their pricing strategy. Research from Hostfully found properties that adjust pricing around major events can increase revenue by up to 40% during those periods. Our own World Cup 2026 short-term rental report found something similar. Across roughly 385,000 listings in 10 U.S. host metros, asking rates rose about 20% and income per listing rose about 14% against comparable markets, while listings within 2 km of a stadium earned roughly 30% to 42% more.
5. Benchmark comparable properties
Market averages hide a lot. A three-bedroom cabin with a hot tub and a studio downtown don't compete for the same guests, even in the same market.
Build a comp set of comparable Airbnb properties: same size, similar amenities, similar location. Then compare their occupancy patterns, average daily rate (ADR), and revenue estimates. This is where direct competitors and competitor pricing come into focus. If comparable listings in your target market consistently book above 65% at a healthy rate, you've found strong investment potential.
A revenue calculator or vacation rental income calculator can help turn those comps into realistic rental income projections for a potential Airbnb investment.
6. Check local regulations before you buy
Finally, check local regulations and licensing rules before buying a rental property. Short-term rental regulations can wipe out demand for unlicensed hosts overnight, no matter how strong the market data looks. Our guide to Airbnb regulations by state is a good starting point.
Where to find free Airbnb data and demand maps
You don't need an expensive subscription to start. Several platforms publish free Airbnb data, including city-level occupancy, ADR, and active listings. Many also offer an Airbnb demand map or heatmap view, which lets you compare markets and neighborhoods side by side.
Free tools are ideal for a first pass. When you're close to a purchase, paid platforms give you property-level data, revenue estimates for short-term rental properties, real time data on pricing, and raw data exports for your own market analysis. For a deeper walkthrough, see our guide to short-term rental market analysis.
What Is a Good Airbnb Occupancy Rate?
A good Airbnb occupancy rate is generally anything above 65%. Rates between 50% and 65% are typical for a healthy full-time listing, and full-time properties below 50% are usually seen as underperforming.
The average Airbnb occupancy rate depends on who you ask, because each data provider measures it differently:
- AirDNA forecasts a U.S. average occupancy rate of 57.4% for 2026, slightly above the pre-pandemic average of 57.0%. AirDNA counts only nights that are available to book.
- Rabbu puts the U.S. Airbnb average occupancy rate at 39% in its October 2026 market data.
- Many guides, including earlier versions of this one, quote a nationwide average of around 48%.
The gap comes from methodology, such as whether blocked nights and part-time listings are included. That's why you should always benchmark against your specific market and your own comp set, not a national number, so you can judge revenue potential accurately. Our guide to improving your Airbnb occupancy rate covers how to close the gap if you're below your market.
Is Airbnb Demand Growing or Declining?
Airbnb demand is growing, but at a steadier pace than the post-pandemic boom.
Here's what the latest numbers show:
- Airbnb's own results: Nights and seats booked rose 10% year over year in Q2 2026, and gross booking value rose 16% to $27.2 billion, according to Airbnb's Q2 2026 financial results. Airbnb expects low double-digit growth in nights and seats booked for Q3.
- AirDNA's 2026 midyear outlook: U.S. demand is forecast to grow 2.7% in 2026, matched by 2.7% supply growth, with RevPAR up 2.9% on stronger nightly rates. AirDNA's headline for the 2026 midyear update is that it's "a better year to own than to buy."
- Short-term rentals vs. hotels: CBRE reported that U.S. short-term rental demand grew 6.0% in May 2025, while traditional hotel demand contracted 0.3%.
There's one soft spot. AirDNA's midyear update found international short-term rental demand to the U.S. running 12% below the previous spring, with Canadian demand down 32% from 2024 levels. Domestic travel is doing the heavy lifting, which is good news for most hosts, since domestic guests are the core of most U.S. markets anyway.
So, is the short-term rental industry declining? No, but it's changing. The 2010s gold rush of listing any property and watching the bookings roll in is over. What's left is a more mature market that rewards hosts who run their listings like a business.
What's Driving Airbnb Demand in 2026?
Several structural forces are shaping where and how guests book right now.
Shorter booking windows
Booking windows are shrinking as travelers book closer to their departure dates. According to Airbnb's 2026 travel predictions, Gen Z is driving a surge in short getaways booked just days before departure. That's why static rates set months ahead leave money on the table, and why dynamic pricing tools that adjust as check-in approaches matter more every year.
Events and gatherings
Searches for vacation rentals spike around major events. Airbnb's 2026 travel predictions found 65% of the most-searched 2026 travel dates lined up with specific global events. Concerts, festivals, championship games, and conventions all create short, sharp demand spikes that hosts can price for.
Remote work and longer stays
Remote work is now a permanent part of travel. For remote workers and digital nomads, high-speed Wi-Fi and a dedicated workspace are crucial amenities, not nice-to-haves. Hosts who lean into 28-plus-night stays can pull more revenue out of the same property in slower months.
Social media and unique stays
Travelers increasingly choose stays with a unique look and feel, often after seeing them on Instagram or TikTok. PriceLabs cites research showing 81% of Gen Z and Millennial travelers plan trips based on content they've seen on-screen or on social media. Tiny homes, cabins, treehouses, and A-frames with a strong visual identity are pulling ahead of cookie-cutter listings.
Younger travelers are also the most likely to choose a rental over a hotel. A 2026 NerdWallet survey conducted by The Harris Poll found 51% of Americans would rather stay in a vacation rental than a hotel, with younger generations more likely to prefer vacation rentals than older ones.
Nature and national parks
Properties near national parks and outdoor destinations are increasingly popular. Airbnb reports searches for stays near U.S. national parks are up 35% for 2026. Joshua Tree, the Smoky Mountains, and Shenandoah continue to attract steady booking volume from hikers, climbers, and outdoor travelers.
Larger homes, groups, and pets
Demand for properties with multiple bedrooms is rising as group and multi-generational travel grows. Large Airbnb rentals with communal spaces, like big kitchens, dining tables, and outdoor areas, appeal to families who want to vacation together.
Demand for pet-friendly stays is rising too, as pet ownership grows. The American Pet Products Association's 2025 survey found 94 million U.S. households now own at least one pet, up from 82 million in 2023, and plenty of them want to bring their pets along.
Value compared with hotels
Travel spending is still a key driver of vacation rental demand, and when hotel prices rise, demand for affordable alternatives rises with them. For groups and families, Airbnb rentals often deliver more space per dollar than two or three hotel rooms.
Where Is Airbnb Demand Strongest in 2026?
Airbnb demand by city varies more than ever, so here's how the latest market performance data breaks down. When you compare markets, look at revenue growth and supply, not just occupancy.
Markets where supply has tightened. AirDNA's midyear update shows the strongest year-to-date RevPAR growth in San Francisco (+12.1%), Anaheim (+11.0%), and Philadelphia (+10.1%), all markets where supply has tightened. Limited supply against steady market demand is helping existing hosts earn more.
Coastal, mountain, lake, and suburban markets. AirDNA's 2026 outlook named coastal destinations, mountain and lake markets, and suburban areas of major U.S. cities as having some of the most favorable conditions for investors.
The suburban spillover. When big cities restrict short-term rentals, demand doesn't disappear. Some of it moves to the suburbs. Our study of New York's short-term rental crackdown found that for every 100 booked nights New York City lost, the surrounding commuter counties gained about 13.
National parks and scenic destinations. These remain reliable demand engines for first-time investors. Our guides to the best vacation rental markets and the best Airbnb locations cover specific picks.
The pattern across high-performing markets is consistent: a strong tourism draw, a clear regulatory framework, and either year-round appeal or a peak season long enough to carry the numbers.
Is the Airbnb Market Saturated?
Some local markets are saturated, but the U.S. Airbnb market as a whole isn't. Saturation happens when new listings arrive faster than new guests, and occupancy falls as a result. With AirDNA forecasting demand and supply both growing 2.7% in 2026, the national short-term rental market is roughly in balance.
Saturation is a local question. AirDNA expects the strongest supply growth in small-city, rural, and mid-size markets, so those are the places to check most carefully. To spot saturation in your target market:
- Compare the growth in active short-term rental listings with the growth in booked nights over 12 to 24 months
- Watch for falling occupancy rates alongside a rising number of Airbnb listings
- Check whether ADR is flat or falling as hosts compete on price
- Look at how many new listings are similar to the property you're considering
If the data shows supply outpacing demand, look for a niche the market isn't serving, like larger homes, pet-friendly stays, or properties with standout amenities.
Local Challenges That Affect Airbnb Demand
Stricter regulations in major cities
Local regulations can significantly reduce the number of short-term rentals available in a market. New York City is the clearest example. Under Local Law 18, hosts renting for fewer than 30 days must register with the city, can host no more than two guests at a time, and must be present for the entire stay. Booking platforms must verify registration before processing bookings.
The impact has been huge. Our analysis found New York's short-term rental supply fell about 80% compared with a modeled scenario without the law. As of mid-2026, a little over 3,500 hosts were registered with the city's Office of Special Enforcement.
Other cities, from San Francisco to Austin and Asheville, have their own registration and permit rules. Always check whether your city has pending short-term rental restrictions coming into force, because the cost of non-compliance can wipe out a year of revenue.
Natural disasters and insurance pressure
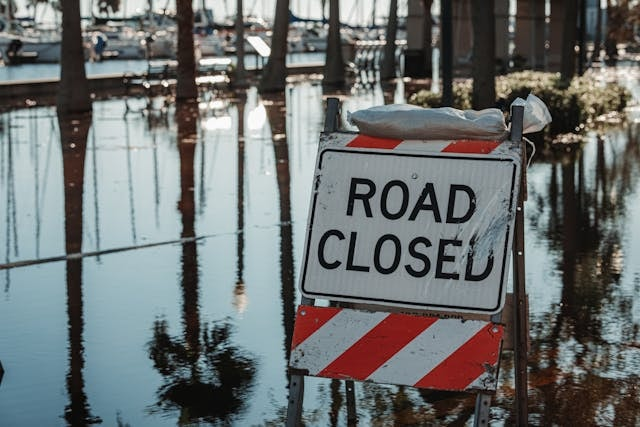
Extreme weather is a growing factor in where guests book. Hurricanes, wildfires, floods, and heatwaves disrupt travel plans and push up insurance costs. Hosts in disaster-prone areas may need to invest in property reinforcements, offer flexible cancellation terms, or adjust pricing to stay competitive.
Interest rates and property prices
Higher interest rates and rising property prices across the real estate market have made it harder for new investors to buy, which has slowed new supply. For existing hosts, that's a net positive. For prospective buyers, properties need to perform at a higher level to pencil out, which is why so many real estate investors are favoring markets with proven occupancy histories over speculative new areas.
How to Capture More Airbnb Demand
Not every Airbnb property earns the same revenue, even on the same street. The difference usually comes down to optimization.
Turn on Instant Book
Guests increasingly expect to book on the spot. Airbnb reported that 60% of bookings were made with Instant Book back in 2017, and it has kept pushing the feature since. If you approve every request manually, you're filtering out a large share of potential guests. Here's how to set up Airbnb Instant Book without losing control over who stays.
Invest in professional photos
Airbnb has long reported that hosts who use professional photos can earn up to 40% more than other listings in their area, and listings with professional photos are booked 24% more often. Photos matter even more now that so many travelers discover stays on social media first. Our Airbnb photos guide walks through how to get it right.
List every amenity that matters
Audit your listing to make sure every amenity you provide is checked off, especially Wi-Fi, a workspace, parking, and kitchen basics. Missing amenities can push your listing out of guests' filtered searches. Bigger upgrades like hot tubs, fire pits, EV chargers, and pet-friendly setups can lift bookings too. Our Airbnb supplies checklist helps you cover the basics.
Use dynamic pricing
With booking windows shrinking and demand shifting around events and seasons, fixed rates leave money on the table. Dynamic pricing tools adjust your nightly rates based on demand, competitor pricing, and local events, so you can adjust pricing automatically instead of guessing. Pair it with a clear Airbnb pricing strategy and a solid revenue management process.
Run Your Short-Term Rental Business Like a Pro
The hosts and property managers who thrive in 2026 run their vacation rental listings like a business. That means automating the repetitive work, like guest messaging, cleaning schedules, review requests, and rate updates, so you can focus on growth instead of inbox triage.
iGMS brings it all together in one platform: a channel manager that syncs your calendars across Airbnb, Vrbo, and Booking.com, automated guest messaging, cleaning coordination, and accounting and reporting that shows how each property is performing. On PRO+ plans, Revenue Management and Dynamic Pricing help you respond to demand shifts in real time. It works for one property or a hundred, and it's built specifically for short-term rental operators.

Frequently Asked Questions
How do I find Airbnb occupancy rates in my area?
To find Airbnb occupancy rates in your area, use a short-term rental analytics tool like AirDNA, Mashvisor, Airbtics, Rabbu, or PriceLabs. Search your city or ZIP code, then filter for similar properties by size and property type. Review at least 12 months of occupancy data rather than a single month.
What is a good Airbnb occupancy rate in 2026?
A good Airbnb occupancy rate in 2026 is generally above 65%. AirDNA forecasts a U.S. average of 57.4% for 2026, while other sources quote figures from about 39% to 48%. Always benchmark against similar Airbnb rentals in your specific market.
Is Airbnb still profitable in 2026?
Yes, Airbnb is still profitable in 2026 for hosts who choose the right market and optimize their listings. With supply growth slowing and demand still rising, AirDNA describes 2026 as a better year to own than to buy. Profitability depends on listing quality, pricing strategy, and local short-term rental regulations.
Where is the highest demand for Airbnb?
Airbnb demand is highest in established tourist destinations, coastal, mountain, and lake markets, areas near national parks, and suburbs of major cities. In 2026, markets where supply has tightened, like San Francisco, Anaheim, and Philadelphia, have posted some of the strongest revenue growth.
Is the Airbnb market saturated?
The overall U.S. Airbnb market isn't saturated, since AirDNA expects demand and supply to both grow 2.7% in 2026. Some local markets are saturated, though. Check whether active listings are growing faster than booked nights, and whether occupancy is falling as a result.
What is the 75/55 rule for Airbnb?
The 75/55 rule is a pricing rule of thumb some hosts use. The idea is to sell about 75% of your nights at your target nightly rate, and never discount below 55% of that target, even for last-minute bookings. It's not an official Airbnb policy, so test it against your own market data.
Final Thoughts
Airbnb demand in 2026 isn't a single number. It's a pattern that depends on location, seasonality, regulations, supply trends, and how well you run your listing. The fundamentals haven't changed: pick an Airbnb market with real, consistent demand, analyze the data carefully, and keep optimizing.
What has changed is the bar. Professional photos, dynamic pricing, Instant Book, complete amenity lists, and automation are now the baseline for any host who wants a profitable year. If you're ready to run your short-term rental business like a professional operator, iGMS gives you the tools to do it.
About the Author
Zorica Milinkovic is a B2B SaaS writer who is passionate about psychology, marketing, and, when inspiration strikes, cooking. You can find her on LinkedIn.